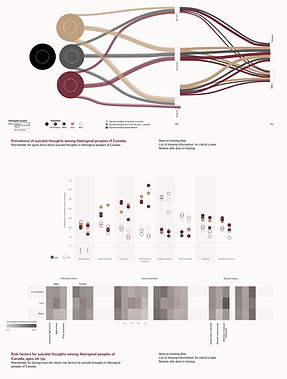
Suicidal Ideation in Indigenous Canada
This information visualization graphic was created for a data visualization course in the Biomedical Communications program. The goal of this project was to create a visual interpretation of a large and complex set of data whose message(s) would otherwise be difficult to glean. In particular, the graphic aimed to create a contextualized story about Indigenous suicidal ideation which facilitates comparison and highlights differences in key aspects of the data.
Clients: Prof. Jodie Jenkinson
Audience: general public
Format: web (desktop)
Medium: Adobe Illustrator, Tableau
Date: February 2019

Process work
First iteration
The first iteration of this piece visualized data on perceived mental health as well as suicidal ideation. The original goal was to demonstrate the relationship between mental health and suicidal ideation. Several visualization strategies were explored, both for perceived mental health data and suicidal ideation data; however, options were limited due to missing data and the data's aggregate nature.
_process%20work-01_.png)
_process%20work-03_.png)
_process%20work-02_.png)
_process%20work-04_.png)

-01.png)
Second iteration
After completing the first iteration, I considered the story presented therein and the additional information an audience might expect or hope to learn about when going through the piece as a whole. Based on this reflection, I decided to eliminate the perceived mental health data from the visualization and in its place incorporate data on risk factors for suicidal thoughts - thereby focusing the subject matter on suicidal ideation.
This iteration also endeavoured to address outstanding challenges posed by the first iteration, including treatment of negative space and low data-ink ratio. Ultimately, I decided upon a complete redesign.
_process%20work-04_.png)
_process%20work-06_.png)
_process%20work-08-.png)
-01.png)
Final iteration
The final iteration narrowed its focus to rates of suicidal ideation alone. The goal was improve upon particular shortcomings of the previous iteration, i.e. facilitating quick and accurate comparisons of the data. I opted for another complete redesign.
You can read about my design rationale here.


